One of the great things about Siggraph is getting glimpses into image processing research that we eventually see end up in products we can use. It runs the range from incredibly technical algorithms to research that ends up in a product, like the Grid Warper in After Effects. To that end, we were excited to attend the “Let’s Do the Time Warp” session, which had some great presentations, all centered around temporal photography. And one of them is already available in a shipping product. We provide a bit of info about the projects, as well as links to the research so you can learn more details.
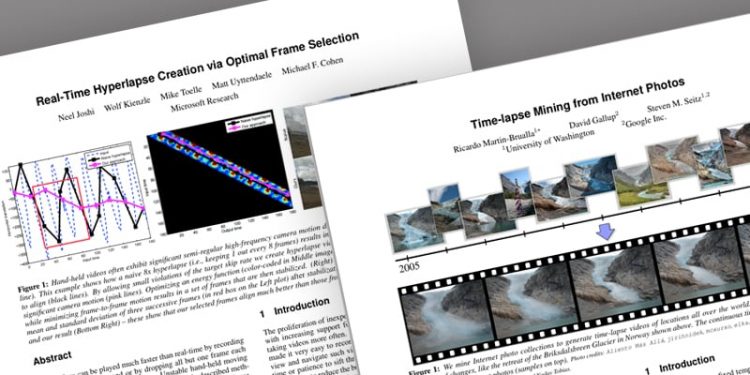
Real-Time Hyperlapse Creation via Optimal Frame Selection
Neel Joshi, Wolf Kienzle, Mike Toelle, Matt Uyttendaele, Michael F. Cohen
Microsoft Research
Researchers from Microsoft presented a paper on new research which covers converting existing videos into hyperlapse videos. Hyperlapse is a term which refers to a “smoothed out” timelapse, which results in a clearer experience for the viewers. There have been several papers at Siggraph in the past regarding creating Hyperlapse videos, including last year’s research paper by Microsoft’s Johannes Kopf. What makes this year’s paper different is a couple of things. First is the fact that the processing runs in real-time on the desktop (about 40fps) or near real-time on mobile devices. Previous implementations generally used some kind of post-processing in order to create the hyperlapse. The other difference factor is that the algorithms don’t need access to external gyro information, which is how Instagram’s hyperlapse works so well — it actually takes the motion of the phone into account when generating the final result.
How does it do it?
For sake of explanation, let’s consider footage acquired by a GoPro camera mounted on a bike where we wish to do a 8x speed-up. First, optimal frames are chosen so that there is less stabilization that needs to be done. Consider a normal timelapse with a ten times speed-up where every 8th frame is grabbed, dropping the ones in-between. While this is technically accurate, there is no accounting for the image content. For instance, maybe on the 800th frame, the bike hit a pothole which caused the image to jump greatly. Chances are, this is going to happen quite frequently over the duration of the ride and the rigid picking of every 8th frame causes a jerky timelapse.
But in the case of optimal frame selection, frames on either side of the 8th frame are considered in deciding which frame to pick and the algorithm picks a frame which has the closest amount of similar content to the previous or next frame. This content-matching is balanced by the opposite force of making sure that the timelapse runs at the desired input speed. So consider it kind of a tug of war or balancing act between image content and speed — and a cost matrix is created to plot out the appropriate frames to pick to generate the timewarp.
Once the frames are chosen, 2D image stabilization occurs in order to smooth out the motion. This happens by tracking features over several frames (not just frame to frame) since the algorithm needs to distinguish between in-scene foreground motion and static background features. After the optimal path is created, the stabilization occurs, including compensating for the rolling shutter artifacts which are generally found in mobile cameras.
According to the paper, “The primary limitations of our method are when there is significant parallax in a scene, when there is not a lot of visual overlap between nearby frames, or if the scene is mostly non-rigid. In these cases, the gyro approach of Instagram and the 3D reconstruction approach of Kopf et al. can help. While we have used these methods as our primary points of comparison, it is important to note that our method is quite complementary to those approaches, and an interesting area for future work is to combine these approaches>”
The software is available for download on the desktop (Windows) and also on Windows Phone and Android. There are a few processing trade-offs which are taken on mobile ( for instance only 1, 2, 4, 8, 16, and 32 times speedups are allowed), but the results are still impressive.
Watch a video to find out more, below, and download the Siggraph research paper.
Time-lapse Mining from Internet Photos
Ricardo Martin-Brualla, David Gallup, Steve M. Seitz
University of Washington, Google Inc
Instead of speeding up a movie, this project uses a number of photographs taken of a single location over time and create a timelapse which could span several years. In a rather stunning example, they created a timelapse of a shrinking glacier field sourced from ten years of images gathered from 2005 to 2015. These were all photographs taken from a variety of people and from a variety of viewpoints.

The first step is to collect similar images. They have created an automated system which does this by examining geotags, ensuring that there are enough photos for a given landmark location. They then calculate a 3D reconstruction of the entire location and from that find popular viewpoints into which images are grouped. It’s quite common to find photos taken from similar locations, such as an observation deck or overlook, the corner of a street, or simply an angle that catches someone’s eye. Next, representative images are then chosen for each group, by finding images that share the most features within the group.
The image on the right, from the research paper, shows this via a “top-down view of the Briksdalsbreen Glacier reconstruction. Red and green points correspond to the 9411 camera centers in the SfM reconstruction. The reference image for the time-lapse is shown in top left and the blue star represents its camera center. Selected cameras for the time-lapse are shown in green and discarded cameras in red. The two images on the right correspond to other clusters in the distribution of photos of the scene. Photo credits: Daikrieg, jirihnidek and Nadav Tobias”
They then do a complex geometric stabilization using depth maps to align the images. It is not a straightforward task, as they must deal with occlusions (objects like people or trucks or new buildings) crossing over the scene, as well as changes in time to objects in the scene (such as seasons or in the case of the glacier, the glacier itself).
Once the images in the sequence are stabilized, the final step is to adjust the colors in the scene for smoothing out the obvious differences in exposure, time of day, and weather conditions. In general terms, this is done by analyzing each and every pixel individually over time. When plotting this, an average color for a pixel can been over time…such as varying blues of the sky or green in the grass. An occlusion in a given frame, such as the aforementioned person, also becomes quite visible as it appears as a drastic color change. Based upon the plot of pixel color values, a temporal smoothing of the colors occurs, such as correcting the blue sky value to an average blue value. The algorithms used do take into account changes in a scene which become permanent. For instance, in the video below, there is a timelapse of the building of the Goldman Sachs Tower in New York. At one point, as the building grows, a pixel would change from blue sky to the color of the building…and then the color of the windows. This type of change is taken into account as can be seen in the final result.
It all ends up to be a very cool crowd-sourced timelapse. One drawback is that, unsurprisingly, the researchers discovered that there are a lot of photos with incorrect timestamps. But their methods do take this into account and for the most part it is a problem which can be dealt with.
Watch a video of the results, below, and download the Siggraph research paper.